













How does TopDividendTools achieve about 30 days of revenue of $6,619 and cumulative revenue of $47,644?
Headline cites the Historical Research Snapshot. KPI strip is the Latest Revenue Snapshot.
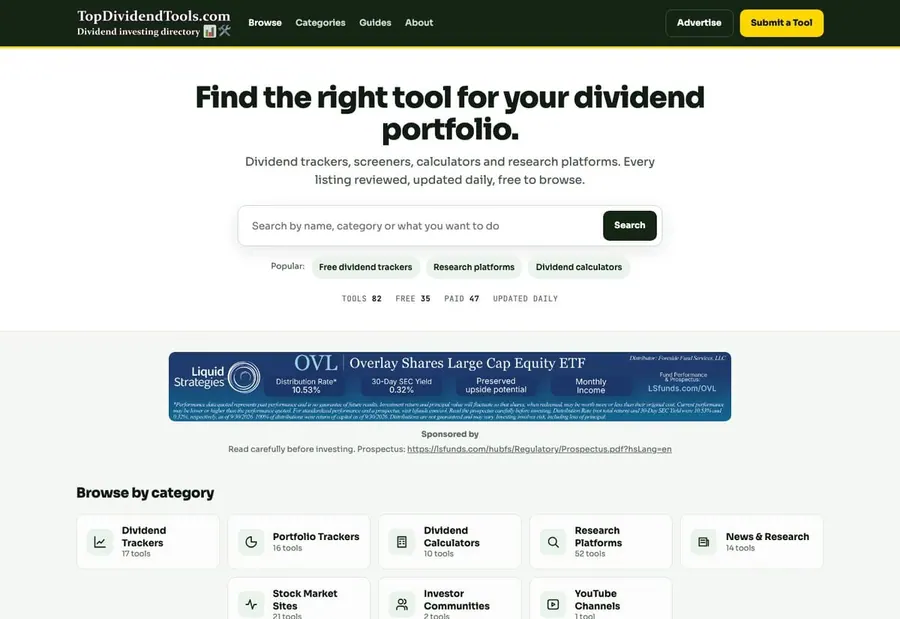
Product at a glance
- what is it
- TopDividendTools is a directory website that collects and reviews dividend investment and stock market tools.
- who is it for
- Dividend investors, passive income seekers, and self-selected stock researchers.
- how does it charge
- Browsing is completely free, and there are both free tools and paid subscription tools in the station, as well as paid recommendation positions.
- business model
- It accumulates traffic through a free directory, and then sells selected display positions and promotion cooperation to tool parties for profit.
- Revenue for the past 30 days
- $8,036
- monthly recurring revenue (MRR)
- $320
- Accumulated total revenue
- $50.9K
As of 2026-10-30
Open evidenceFact · as of 2026-11-04
Evidence type: Fact
Source: Latest Revenue Snapshot · provider payment sync
as of: 2026-11-04
Provider-verified revenue signal ≠ audited company financials.
As of 2026-10-30
Open evidenceFact · as of 2026-11-04
Evidence type: Fact
Source: Latest Revenue Snapshot · provider payment sync
as of: 2026-11-04
Provider-verified revenue signal ≠ audited company financials.
revenue data as of 2026-11-04 (public channel, updated daily)
Open evidenceFact · as of 2026-11-04
Evidence type: Fact
Source: Latest Revenue Snapshot · provider payment sync
as of: 2026-11-04
Provider-verified revenue signal ≠ audited company financials.
MRR = current monthly recurring run rate · 30-Day revenue = what the provider recorded in the trailing 30 days. Timing, not extra revenue, is why a ratio can exceed 100%.
Summary
What kind of business is this
Visit site topdividendtools.comThe site categorizes and includes tools such as dividend trackers, filters, and calculators, marked as free or paid and updated daily. Users often enter through search, and complete the conversion by comparing and jumping to the tool page.
- Product form
- Web online software workstation
- Category
- Marketplace
- Charging method
- Online self-service subscription
Core growth findings
Findings may cite earlier snapshots; header KPIs carry Fact and a revenue as-of date. Revenue as of 2026-11-04.
- 01
Positioning and self-service conversion
Using free browsing plus paid selected tiering, tool parties can self-service on the shelf and purchase home page recommendation positions on the submission page.
- 02
Community and creator distribution
Share comparison lists on dividend investment communities, forums, and YouTube channels, and use creators' word-of-mouth to divert and exchange listings.
- 03
Search terms and directory external links
Centered on keywords such as dividend tracker and ETF screening, landing pages were created, and exposure was exchanged with related tool directories and financial websites.
- Number tags
- FactStraight from the source
- DerivedCalculated from facts
- ClaimedSelf-reported, unverified
- EstimateOur reading
Read this one free
This device has 2 of 2 free full reports left. After this one, the rest of the library needs a membership.
- ?What product structure supports $8.0K a month?
- ?Which channels bring customers in, and which of them actually pay?
- ?Can this playbook be copied, and under what conditions?
- 01The business
- 02Where customers come from
- 03Growth plays
- 04Social & community
- 05Timeline
- 06What to copy
This report is free to read
2 free reports left on this device
Next steps
Copy an agent prompt above, then keep researching related products via MCP.