













How did SoldComps achieve revenue of $25,469 in the last 30 days and accumulated revenue of $63,506?
Headline cites the Historical Research Snapshot. KPI strip is the Latest Revenue Snapshot.
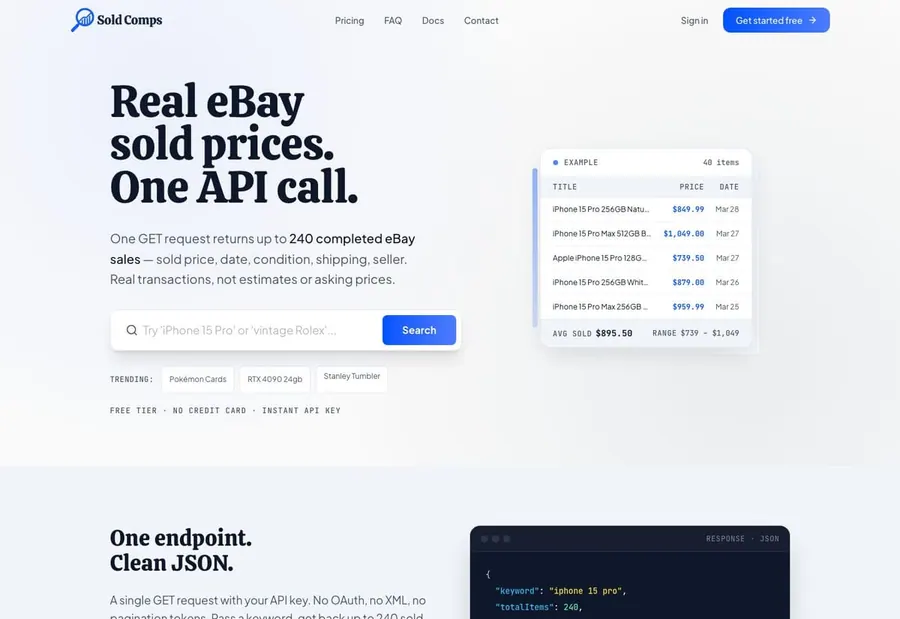
Product at a glance
- what is it
- Enter a keyword, and a single GET request can return up to 240 eBay completed transactions, including transaction price, date, condition, shipping fee, and seller information.
- who is it for
- Second-hand resellers, refurbished sellers, and selection and pricing analysts who need bulk real transaction data.
- how does it charge
- Subscription is charged per month, with pricing tiers based on the number of monthly requests; the free tier starts at the beginning, and the larger the request volume, the lower the unit price per search.
- business model
- The subscription model charges based on the monthly search request volume, with one request corresponding to one keyword, and the number of returned results does not affect the billing.
- Revenue for the past 30 days
- $25.8K
- monthly recurring revenue (MRR)
- $24.9K
- Accumulated total revenue
- $68.6K
As of 2026-10-30
Open evidenceFact · as of 2026-11-04
Evidence type: Fact
Source: Latest Revenue Snapshot · provider payment sync
as of: 2026-11-04
Provider-verified revenue signal ≠ audited company financials.
As of 2026-10-30
Open evidenceFact · as of 2026-11-04
Evidence type: Fact
Source: Latest Revenue Snapshot · provider payment sync
as of: 2026-11-04
Provider-verified revenue signal ≠ audited company financials.
revenue data as of 2026-11-04 (public channel, updated daily)
Open evidenceFact · as of 2026-11-04
Evidence type: Fact
Source: Latest Revenue Snapshot · provider payment sync
as of: 2026-11-04
Provider-verified revenue signal ≠ audited company financials.
MRR = current monthly recurring run rate · 30-Day revenue = what the provider recorded in the trailing 30 days. Timing, not extra revenue, is why a ratio can exceed 100%.
Summary
What kind of business is this
Visit site sold-comps.comSoldComps turns eBay transaction data into a clean JSON interface, with a free quota and instant key to allow developers to get started with zero threshold. Subsequently, layered subscription based on request quantity, usage dashboard, and high concurrency level to undertake the continuous demand of professional buyers.
- Product form
- Web online software workstation
- Category
- Analytics
- Charging method
- Online self-service subscription
Core growth findings
Findings may cite earlier snapshots; header KPIs carry Fact and a revenue as-of date. Revenue as of 2026-11-04.
- 01
Self-service API and usage tiering
Free quota, no credit card required to issue API key immediately, with clear request volume tiering, allowing users to upgrade to paid naturally in real calls.
- 02
Community and founder distribution
Publish real transaction cases and tutorials in resale, refurbishment, and e-commerce communities, and the founder answers questions and acquires customers directly on Reddit, Discord, and other channels.
- 03
Search terms and directory exposure
Create documentation and comparison pages around keywords such as eBay transaction price inquiry and sold comps API, and submit to developer directories and API lists to obtain external link traffic.
- Number tags
- FactStraight from the source
- DerivedCalculated from facts
- ClaimedSelf-reported, unverified
- EstimateOur reading
Read this one free
This device has 2 of 2 free full reports left. After this one, the rest of the library needs a membership.
- ?What product structure supports $25.8K a month?
- ?Which channels bring customers in, and which of them actually pay?
- ?Can this playbook be copied, and under what conditions?
- 01The business
- 02Where customers come from
- 03Growth plays
- 04Social & community
- 05Timeline
- 06What to copy
This report is free to read
2 free reports left on this device
Next steps
Copy an agent prompt above, then keep researching related products via MCP.