













How did Price Per Token achieve nearly 30 days of revenue of $1,800 and cumulative income of $5,700?
Headline cites the Historical Research Snapshot. KPI strip is the Latest Revenue Snapshot.
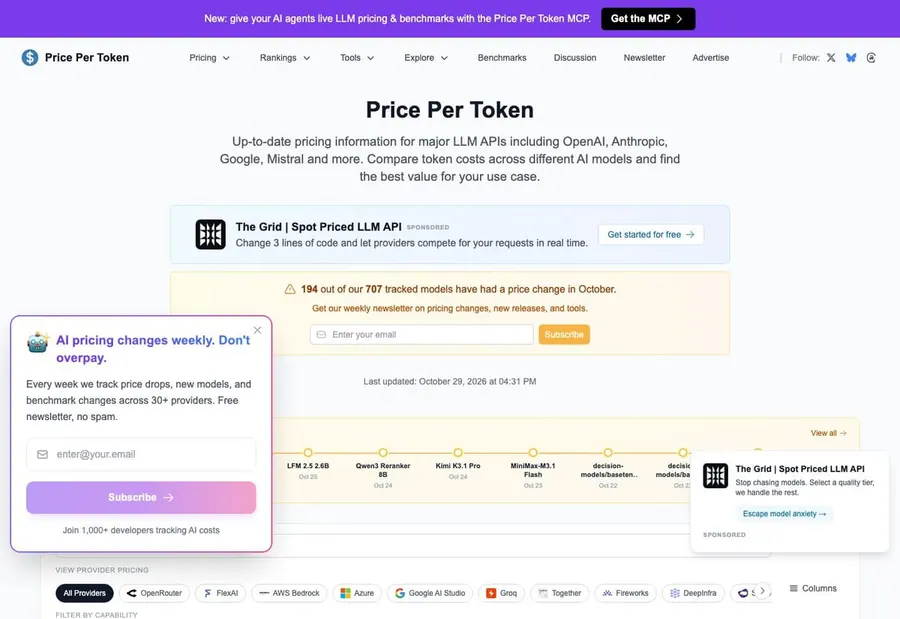
Product at a glance
- what is it
- Summarize the input, output, and caching prices of over 300 large model APIs for horizontal comparison.
- who is it for
- Developers who need to control costs, AI product teams, and procurement personnel.
- how does it charge
- The website browsing is completely free, and it is monetized through advertisements and sponsored positions, without charging visitors.
- business model
- Use free comparison tools to aggregate traffic, and then monetize through advertising positions and cooperation with sponsors.
- Revenue for the past 30 days
- $1,800
- monthly recurring revenue (MRR)
- $1,800
- Accumulated total revenue
- $5,700
As of 2026-10-30
Open evidenceFact · as of 2026-11-04
Evidence type: Fact
Source: Latest Revenue Snapshot · provider payment sync
as of: 2026-11-04
Provider-verified revenue signal ≠ audited company financials.
As of 2026-10-30
Open evidenceFact · as of 2026-11-04
Evidence type: Fact
Source: Latest Revenue Snapshot · provider payment sync
as of: 2026-11-04
Provider-verified revenue signal ≠ audited company financials.
revenue data as of 2026-11-04 (public channel, updated daily)
Open evidenceFact · as of 2026-11-04
Evidence type: Fact
Source: Latest Revenue Snapshot · provider payment sync
as of: 2026-11-04
Provider-verified revenue signal ≠ audited company financials.
MRR = current monthly recurring run rate · 30-Day revenue = what the provider recorded in the trailing 30 days. Timing, not extra revenue, is why a ratio can exceed 100%.
Summary
What kind of business is this
Visit site pricepertoken.comCombine the prices, benchmarks, and updates of multiple suppliers into a filterable table, and get traffic through rankings and weekly price change emails. Then complete the conversion with sponsored positions and tool entries.
- Product form
- Web online software workstation
- Category
- Utilities
- Charging method
- Online self-service subscription
Core growth findings
Findings may cite earlier snapshots; header KPIs carry Fact and a revenue as-of date. Revenue as of 2026-11-04.
- 01
Price comparison table is the entrance
The home page table defaults to sorting by input price, and visitors can filter out low-price models and click on supplier trials within a few seconds.
- 02
Price change subscription
Weekly push of price increases and new product broadcasts, turning one-time price comparison visitors into subscribable subscribers.
- 03
Long-tail keyword coverage
Building pages around model names and pricing words to capture visitors from search engines and directory sites, and then guiding them back to the price comparison main table.
- Number tags
- FactStraight from the source
- DerivedCalculated from facts
- ClaimedSelf-reported, unverified
- EstimateOur reading
Read this one free
This device has 2 of 2 free full reports left. After this one, the rest of the library needs a membership.
- ?What product structure supports $1.8K a month?
- ?Which channels bring customers in, and which of them actually pay?
- ?Can this playbook be copied, and under what conditions?
- 01The business
- 02Where customers come from
- 03Growth plays
- 04Social & community
- 05Timeline
- 06What to copy
This report is free to read
2 free reports left on this device
Next steps
Copy an agent prompt above, then keep researching related products via MCP.