













A travel booking site without subscriptions, how does it receive $190,000 a year?
Headline cites the Historical Research Snapshot. KPI strip is the Latest Revenue Snapshot.
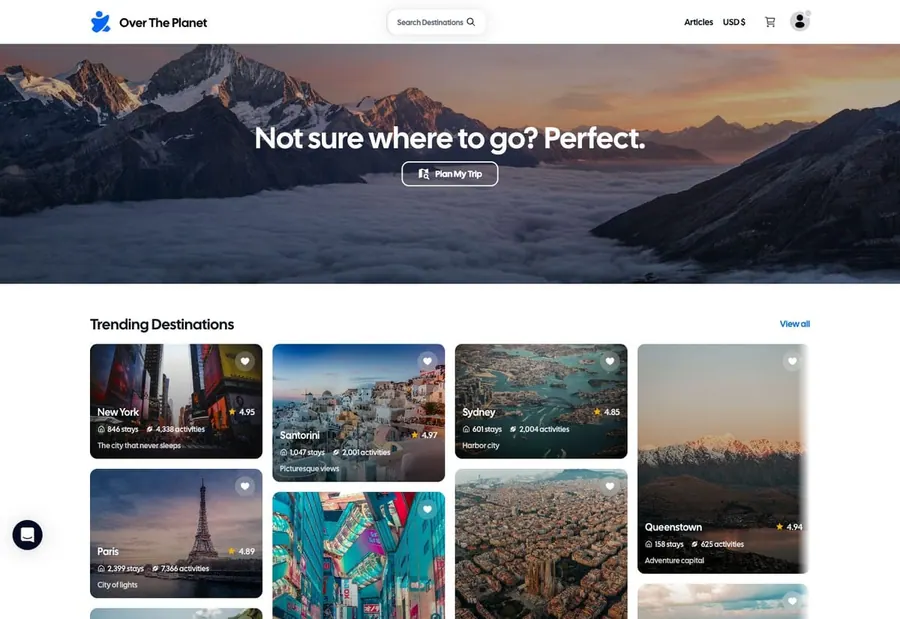
Product at a glance
- what is it
- a travel booking website: selling attraction tickets, local activities and hotel accommodations by destination and date.
- who is it for
- ordinary tourists planning a trip and wanting to book tickets and accommodations, with the most coming from the US.
- how does it charge
- pay per order, with prices varying by date and option, such as a certain water park ticket starting at $73.12 per person, $77.19 per person; payment can be made in full or a deposit can be paid first, with the balance paid later. Refund and change rules are determined by the specific product.
- business model
- tourism e-commerce that collects payment per order, with no subscription.
- Revenue over the past 12 months
- $190K
- 9 month revenue
- $5,658
Accumulated $293K
Open evidenceFact · as of 2026-11-04
Evidence type: Fact
Source: Latest Revenue Snapshot · provider payment sync
as of: 2026-11-04
Provider-verified revenue signal ≠ audited company financials.
January peak is $30.5K
Open evidenceFact · as of 2026-11-04
Evidence type: Fact
Source: Latest Revenue Snapshot · provider payment sync
as of: 2026-11-04
Provider-verified revenue signal ≠ audited company financials.
MRR = current monthly recurring run rate · 30-Day revenue = what the provider recorded in the trailing 30 days. Timing, not extra revenue, is why a ratio can exceed 100%.
Summary
What kind of business is this
Visit site www.overtheplanet.comBefore going to places like Disney and Universal Studios, tourists need to book tickets and hotels. Over The Planet creates a separate page for each ticket and hotel, and then uses paid search to bring people in. After seeing the partner logo and evaluation, tourists can place an order, paying a deposit first, with the money collected per order.
- form
- web booking station
- customers
- tourists
- charging
- Pay per order
- launch
- 2020-07
- team
- founder mengqing · Australia
Core growth findings
Findings may cite earlier snapshots; header KPIs carry Fact and a revenue as-of date. Revenue as of 2026-11-04.
- 01
traffic is almost all bought: paid search accounts for 71.1%
in September, out of 146,842 visits, 104,372 came from paid search, with natural search accounting for only 12.4%, and social media less than 1%.
- 02
people are still coming, but money is decreasing: revenue per visit dropped from $0.13 to $0.04
from July to September, the number of visits increased from 121,000 to 147,000, but monthly revenue fell from $15,489 to $5,658 during the same period. The purchased traffic did not convert into orders.
- 03
One ticket per page, Disney takes up two pages and accounts for about 30% of natural traffic
there are 16,794 keywords ranked in the US; two Walt Disney World ticket pages are estimated to bring in about 12,269 natural visits per month.
- Number tags
- FactStraight from the source
- DerivedCalculated from facts
- ClaimedSelf-reported, unverified
- EstimateOur reading
Read this one free
This device has 2 of 2 free full reports left. After this one, the rest of the library needs a membership.
- ?How does a travel booking site with no subscriptions collect $190k in a year?
- ?Where do its visits mainly come from?
- ?How does a small team with no inventory of its own sell Disney tickets?
- 01The business
- 02Where customers come from
- 03Growth plays
- 04Social & community
- 05Timeline
- 06What to copy
This report is free to read
2 free reports left on this device
Next steps
Copy an agent prompt above, then keep researching related products via MCP.