












A ticketing App that started from a high school party, how did it achieve $3,470,000 in revenue in a year?
Headline cites the Historical Research Snapshot. KPI strip is the Latest Revenue Snapshot.
Product at a glance
- what is it
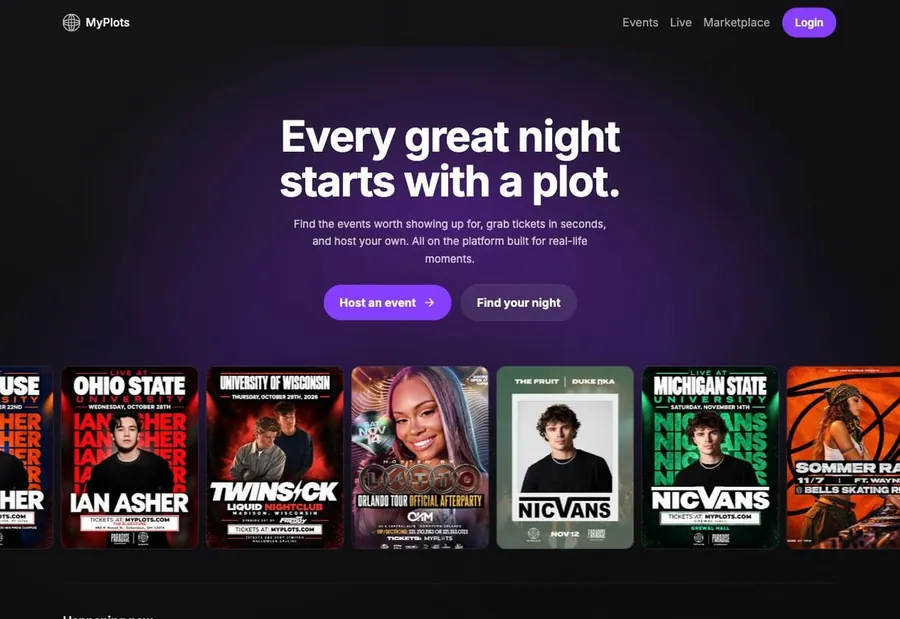
- offline activity App and website: find parties and performances, buy tickets, scan code to enter; organizers can post activities for free, manage teams, send text messages to buyers, and also have equipment rental and ticket transfer market.
- who is it for
- organizers of parties and performances, promoters, and young people who buy tickets, mainly in Los Angeles and US universities; the ones who pay are the ticket buyers.
- how does it charge
- organizers can post activities for free; each paid ticket will be charged 20% + $1.00 handling fee to the ticket buyer, RSVP and free tickets are not charged.
- business model
- ticket platform commission: the platform is free for organizers to use, and it charges a handling fee to buyers from each paid ticket, and it also organizes its own artist performances and sells tickets.
- receipts for nearly 12 months
- $3.55M
- payment for the past 30 days
- $665K
- MRR
- $0
- September revenue
- $491K
Total $4.57M · Publicly Verified
+48% compared to the previous 30 days
Only 3 subscriptions: almost all the money comes from tickets
Open evidenceFact · as of 2026-11-03
Evidence type: Fact
Source: Latest Revenue Snapshot · provider payment sync
as of: 2026-11-03
Provider-verified revenue signal ≠ audited company financials.
Historical high · January had only $174K
Open evidenceFact · as of 2026-11-03
Evidence type: Fact
Source: Latest Revenue Snapshot · provider payment sync
as of: 2026-11-03
Provider-verified revenue signal ≠ audited company financials.
MRR = current monthly recurring run rate · 30-Day revenue = what the provider recorded in the trailing 30 days. Timing, not extra revenue, is why a ratio can exceed 100%.
Summary
What kind of business is this
Visit site myplots.comIan Asher and Nic Vans toured Syracuse, Ohio State, Brown, Duke, and Michigan State, and the promotional videos on the artists' Facebook pages have 54K and 22K plays respectively, all ending with "Tickets at MyPlots.com".
- form
- App + website
- customers
- The organizers and young people who buy tickets
- charging
- Take a cut from tickets
- launch
- 2023-06
Core growth findings
Findings may cite earlier snapshots; header KPIs carry Fact and a revenue as-of date. Revenue as of 2026-11-03.
- 01
The platform itself acts as the largest organizer
It does not wait for others to hold events, but instead books Playboi Carti, Don Toliver, Nettspend, Ian Asher to hold solo concerts and after parties, with the official website listing these 4 artists for a total of 13 nights.
- 02
College tour, let the artists post themselves
Ian Asher and Nic Vans toured Syracuse, Ohio State, Brown, Duke, and Michigan State, and the promotional videos on the artists' Facebook pages have 54K and 22K plays respectively, all ending with "Tickets at MyPlots.com".
- 03
The organizer is free, and the money is collected from the ticket buyers
Holding events does not require money, and paid tickets charge an additional 20% + $1 to the buyer, and also send emails, text messages, and tracking links. The founder told WIRED that 95% of the promoters on the platform are people he does not know.
- Number tags
- FactStraight from the source
- DerivedCalculated from facts
- ClaimedSelf-reported, unverified
- EstimateOur reading
Read this one free
This device has 2 of 2 free full reports left. After this one, the rest of the library needs a membership.
- ?How did a ticketing app born at high-school parties take $3.47M in a year?
- ?Where do its buyers mainly come from?
- ?Why does a ticketing platform run its own shows?
- 01The business
- 02Where customers come from
- 03Growth plays
- 04Social & community
- 05Timeline
- 06What to copy
This report is free to read
2 free reports left on this device
Next steps
Copy an agent prompt above, then keep researching related products via MCP.