













How does MyFrank achieve a revenue of $7,423 in nearly 30 days and an accumulated revenue of $80,127?
Headline cites the Historical Research Snapshot. KPI strip is the Latest Revenue Snapshot.
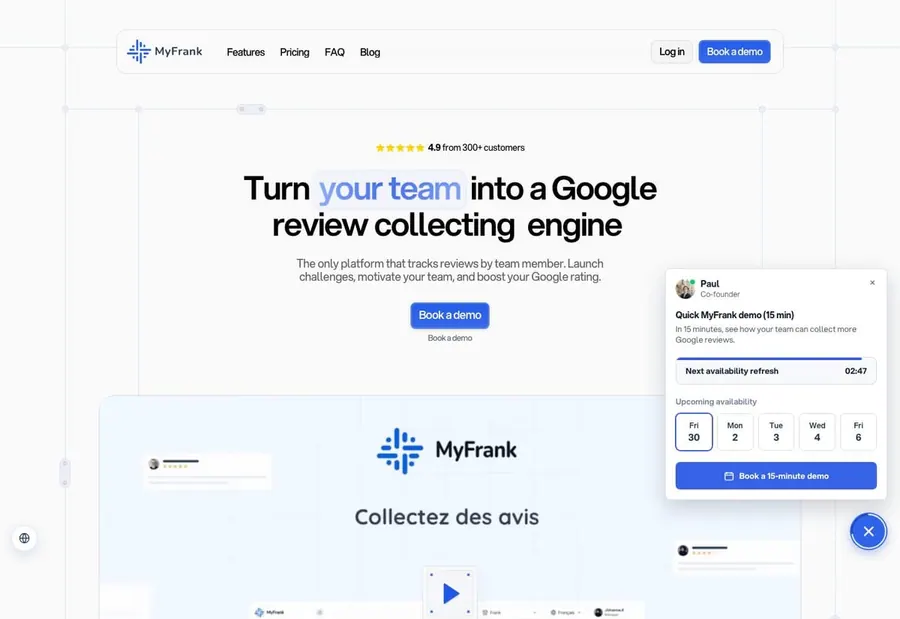
Product at a glance
- what is it
- MyFrank collects and manages Google reviews through employee-exclusive QR codes, attributes them by employee, and supports challenges, rewards, and store performance tracking.
- who is it for
- Multi-store catering, retail, and chain franchise enterprises, paid for by owners or operation and marketing teams.
- how does it charge
- Charged by subscription, usually tiered pricing based on the number of stores and team size, specific plans require appointment demonstrations to obtain.
- business model
- B2B SaaS subscription model, charging software service fees to multi-store enterprises based on the number of stores and team size.
- Revenue for the past 30 days
- $7,078
- monthly recurring revenue (MRR)
- $10.6K
- Accumulated total revenue
- $81.5K
As of 2026-10-30
Open evidenceFact · as of 2026-11-04
Evidence type: Fact
Source: Latest Revenue Snapshot · provider payment sync
as of: 2026-11-04
Provider-verified revenue signal ≠ audited company financials.
As of 2026-10-30
Open evidenceFact · as of 2026-11-04
Evidence type: Fact
Source: Latest Revenue Snapshot · provider payment sync
as of: 2026-11-04
Provider-verified revenue signal ≠ audited company financials.
revenue data as of 2026-11-04 (public channel, updated daily)
Open evidenceFact · as of 2026-11-04
Evidence type: Fact
Source: Latest Revenue Snapshot · provider payment sync
as of: 2026-11-04
Provider-verified revenue signal ≠ audited company financials.
MRR = current monthly recurring run rate · 30-Day revenue = what the provider recorded in the trailing 30 days. Timing, not extra revenue, is why a ratio can exceed 100%.
Summary
What kind of business is this
Visit site myfrank.io/usMyFrank is a Google review management SaaS for multi-store enterprises, using employee QR codes to attribute reviews and gamify team incentives. It guides trial conversions through industry positioning pages, customer word-of-mouth, and appointment demonstrations.
- Product form
- Web online software workstation
- Category
- SaaS
- Charging method
- Online self-service subscription
Core growth findings
Findings may cite earlier snapshots; header KPIs carry Fact and a revenue as-of date. Revenue as of 2026-11-04.
- 01
Employee attribution positioning, demonstration-driven conversion
With the unique selling point of tracking evaluations by employee, highlighting the growth of multi-store reputation, and using a 15-minute demonstration to receive high-intention customers.
- 02
Reputation endorsement and founder demonstration
Showing 300+ clients and a 4.9 rating, combining founder demonstration and catering retail community cases to lower the trust threshold and promote appointments.
- 03
Search keyword and directory exposure
Laying out content around employee QR code collection of Google evaluations, multi-store evaluation management, and other keywords, and entering SaaS directories and comparison lists to obtain external link leads.
- Number tags
- FactStraight from the source
- DerivedCalculated from facts
- ClaimedSelf-reported, unverified
- EstimateOur reading
Read this one free
This device has 2 of 2 free full reports left. After this one, the rest of the library needs a membership.
- ?What product structure supports $7.1K a month?
- ?Which channels bring customers in, and which of them actually pay?
- ?Can this playbook be copied, and under what conditions?
- 01The business
- 02Where customers come from
- 03Growth plays
- 04Social & community
- 05Timeline
- 06What to copy
This report is free to read
2 free reports left on this device
Next steps
Copy an agent prompt above, then keep researching related products via MCP.