












A platform for teaching disabled service institutions, how did it achieve an MRR of $230,000?
Headline cites the Historical Research Snapshot. KPI strip is the Latest Revenue Snapshot.
Product at a glance
- what is it
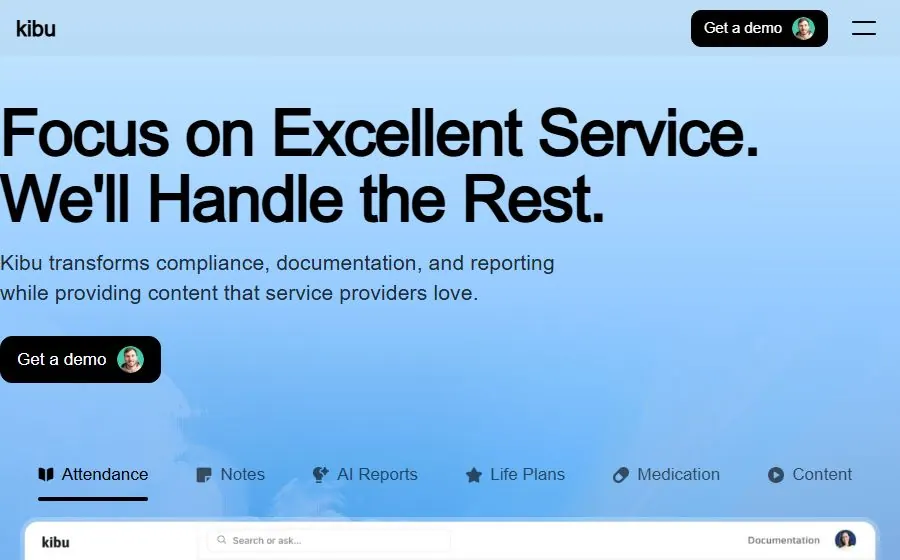
- A platform for disability service agencies: on one hand, courses and activities (on-demand classes, daily live streams, mini games), on the other hand, attendance, service records, medication and compliance report systems.
- who is it for
- Institutions providing daytime projects, accommodation services and employment training for people with intellectual and developmental disabilities, paid by the institutions.
- how does it charge
- No public pricing, customized quotes based on institution scale and projects, requiring a demo appointment before quoting.
- business model
- B2B SaaS subscription for institutions, relying on sales demos to close deals, priced by scale.
- Revenue over the past 12 months
- $1.38M
- MRR
- $234K
- Active Subscriptions
- 375
- 2026 year January revenue
- $449K
Cumulative $3.1M
Open evidenceFact · as of 2026-04-19
Evidence type: Fact
Source: Latest Revenue Snapshot · provider payment sync
as of: 2026-04-19
Provider-verified revenue signal ≠ audited company financials.
30 days +52.8%
Open evidenceFact · as of 2026-04-19
Evidence type: Fact
Source: Latest Revenue Snapshot · provider payment sync
as of: 2026-04-19
Provider-verified revenue signal ≠ audited company financials.
about $625/month per
Open evidenceFact · as of 2026-04-19
Evidence type: Fact
Source: Latest Revenue Snapshot · provider payment sync
as of: 2026-04-19
Provider-verified revenue signal ≠ audited company financials.
highest month · October 2025 only $42.1K
Open evidenceFact · as of 2026-04-19
Evidence type: Fact
Source: Latest Revenue Snapshot · provider payment sync
as of: 2026-04-19
Provider-verified revenue signal ≠ audited company financials.
MRR = current monthly recurring run rate · 30-Day revenue = what the provider recorded in the trailing 30 days. Timing, not extra revenue, is why a ratio can exceed 100%.
Summary
What kind of business is this
Visit site kibu.comInitially providing fitness classes for the IDD population, later growing into a content library of over 600 classes; in 2025, the focus shifted to records and compliance, launching the AI report tool Clara and electronic medication record eMAR, with revenue also increasing from November 2025.
- form
- Web platform
- customers
- Disability service institutions
- charging
- Subscription · Customized Quote
- Starting price
- Contact for Quote
- launch
- 2022-01
Core growth findings
Findings may cite earlier snapshots; header KPIs carry Fact and a revenue as-of date. Revenue as of 2026-04-19.
- 01
Use courses to get in, use compliance to collect money
Initially providing fitness classes for the IDD population, later growing into a content library of over 600 classes; in 2025, the focus shifted to records and compliance, launching the AI report tool Clara and electronic medication record eMAR, with revenue also increasing from November 2025.
- 02
85.7% are direct visits: traffic comes from people using it every day
Each visit averages 17 pages, about 24 minutes, with a bounce rate of 18%. These are not visitors to the official website, but institution employees taking classes and writing records.
- 03
Selling through demos, customer stories and industry associations, not relying on social media
Prices are not publicly disclosed, with 5 'Get a demo' buttons on the homepage and an RFP entry at the footer; the ANCOR partner page includes it. Social media only accounts for 0.53%.
- Number tags
- FactStraight from the source
- DerivedCalculated from facts
- ClaimedSelf-reported, unverified
- EstimateOur reading
Read this one free
This device has 2 of 2 free full reports left. After this one, the rest of the library needs a membership.
- ?How did a class platform for disability providers reach $234k MRR?
- ?Where do its customers mainly come from?
- ?Why do providers pay for it?
- 01The business
- 02Where customers come from
- 03Growth plays
- 04Social & community
- 05Timeline
- 06What to copy
This report is free to read
2 free reports left on this device
Next steps
Copy an agent prompt above, then keep researching related products via MCP.