












A single-person-made chart API, how did it earn $540,000 in 10 years, and why is it now declining?
Headline cites the Historical Research Snapshot. KPI strip is the Latest Revenue Snapshot.
Product at a glance
- what is it
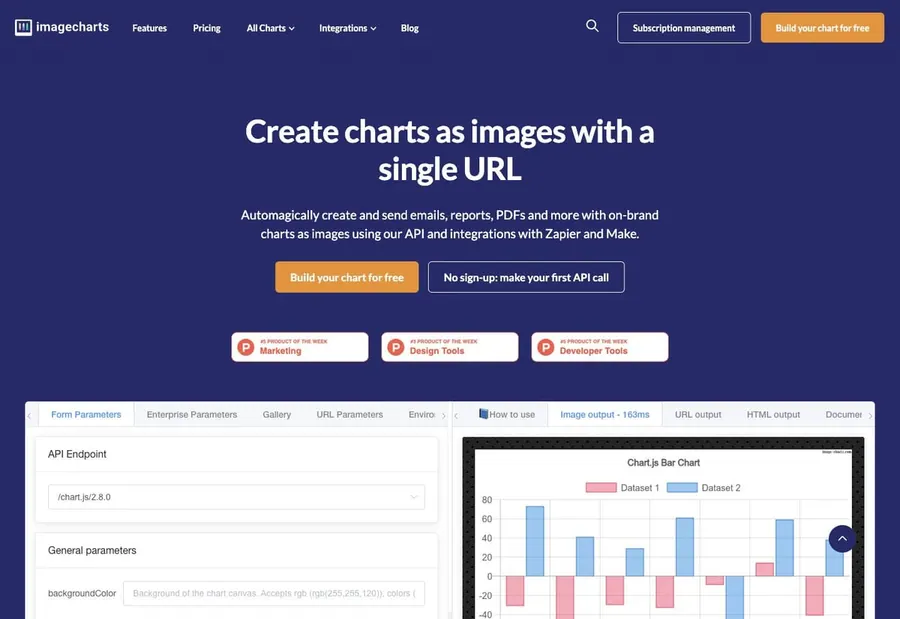
- A chart image API: turns a URL with parameters into a chart image, put into emails, PDFs, chatbots and automation workflows; compatible with some old Google chart parameters.
- who is it for
- Developers, marketers and business teams who want to automatically generate charts in reports and emails, especially those migrating from Google Image Charts.
- how does it charge
- Free version does not require registration, but the image has a watermark and is limited in speed. Paid version has Business: US$99.95/month or US$1069/year.
- business model
- Freemium API subscription: free images with watermarks serve as promotion, money comes from paid versions without watermarks and self-hosted licenses.
- Revenue over the past 12 months
- $78.1K
- MRR
- $6,239
- Paid subscription
- 49
- Cumulative revenue
- $543K
In the past 6 months $22.3K
Open evidenceFact · as of 2026-11-04
Evidence type: Fact
Source: Latest Revenue Snapshot · provider payment sync
as of: 2026-11-04
Provider-verified revenue signal ≠ audited company financials.
30 days -0.7%
Open evidenceFact · as of 2026-11-04
Evidence type: Fact
Source: Latest Revenue Snapshot · provider payment sync
as of: 2026-11-04
Provider-verified revenue signal ≠ audited company financials.
Average about $126/month
Open evidenceFact · as of 2026-11-04
Evidence type: Fact
Source: Latest Revenue Snapshot · provider payment sync
as of: 2026-11-04
Provider-verified revenue signal ≠ audited company financials.
Online at the end of 2016 to present · public verification
Open evidenceFact · as of 2026-11-04
Evidence type: Fact
Source: Latest Revenue Snapshot · provider payment sync
as of: 2026-11-04
Provider-verified revenue signal ≠ audited company financials.
MRR = current monthly recurring run rate · 30-Day revenue = what the provider recorded in the trailing 30 days. Timing, not extra revenue, is why a ratio can exceed 100%.
Summary
What kind of business is this
Visit site www.image-charts.comGoogle Image Charts announced its abandonment in 2012 and was shut down in 2019. Image-Charts uses the same set of parameters, and migration only requires changing the domain name; the founder personally responded to an old question on Stack Overflow, and it is also recommended by someone in the Salesforce plugin documentation and the Google forum.
- form
- API + self-hosted version
- customers
- developers, marketing and business teams
- charging
- Freemium
- Starting price
- US$99.95/month
- launch
- 2017-01
- team
- France · founded by one person · self-funded
Core growth findings
Findings may cite earlier snapshots; header KPIs carry Fact and a revenue as-of date. Revenue as of 2026-11-04.
- 01
A direct replacement for a deprecated API from a big company
Google Image Charts announced its abandonment in 2012 and was shut down in 2019. Image-Charts uses the same set of parameters, and migration only requires changing the domain name; the founder personally responded to an old question on Stack Overflow, and it is also recommended by someone in the Salesforce plugin documentation and the Google forum.
- 02
the free version is an advertisement in itself
the first call is a URL, no registration is required; free charts have an image-charts.com watermark in the top right corner, which can only be removed by paying; direct access accounts for 39.7%, which is the largest source of traffic.
- 03
Revenue is concentrated in large orders every three months, and is getting smaller
January US$18,673, April US$17,007, July US$9,141, the total of these three months accounts for 57% of the revenue for nearly 12 months; other months have only US$2k–7k.
- Number tags
- FactStraight from the source
- DerivedCalculated from facts
- ClaimedSelf-reported, unverified
- EstimateOur reading
Read this one free
This device has 2 of 2 free full reports left. After this one, the rest of the library needs a membership.
- ?How did a one-founder chart API earn $542k in ten years, and why is it slipping now?
- ?Where do its visits mainly come from?
- ?How does the free version sell the paid one?
- 01The business
- 02Where customers come from
- 03Growth plays
- 04Social & community
- 05Timeline
- 06What to copy
This report is free to read
2 free reports left on this device
Next steps
Copy an agent prompt above, then keep researching related products via MCP.