













How did Flowboard achieve revenue of $1,624 in nearly 30 days and cumulative revenue of $10,510?
Headline cites the Historical Research Snapshot. KPI strip is the Latest Revenue Snapshot.
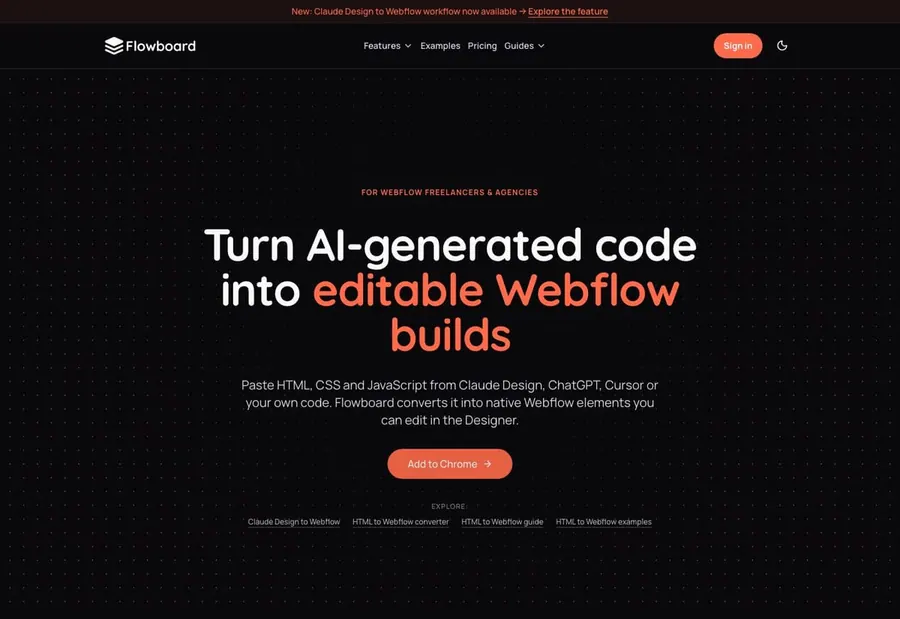
Product at a glance
- what is it
- Flowboard is a Chrome extension that can convert HTML, CSS and JavaScript code into native elements and interactions that can be edited in Webflow Designer.
- who is it for
- Freelancers who deliver websites using Webflow, design studios and agencies, as well as developers who use AI-generated code to create web pages.
- how does it charge
- It adopts a subscription-based model, charging by month or by year, and provides free trials and multiple packages.
- business model
- It monetizes through a layered subscription SaaS model, acquiring customers through the Chrome store entrance and tutorial content, and then upgrading packages gradually.
- Revenue for the past 30 days
- $1,489
- monthly recurring revenue (MRR)
- $1,509
- Accumulated total revenue
- $10.8K
As of 2026-10-27
Open evidenceFact · as of 2026-11-03
Evidence type: Fact
Source: Latest Revenue Snapshot · provider payment sync
as of: 2026-11-03
Provider-verified revenue signal ≠ audited company financials.
As of 2026-10-27
Open evidenceFact · as of 2026-11-03
Evidence type: Fact
Source: Latest Revenue Snapshot · provider payment sync
as of: 2026-11-03
Provider-verified revenue signal ≠ audited company financials.
Revenue data as of 2026-11-03 (public channels, updated daily)
Open evidenceFact · as of 2026-11-03
Evidence type: Fact
Source: Latest Revenue Snapshot · provider payment sync
as of: 2026-11-03
Provider-verified revenue signal ≠ audited company financials.
MRR = current monthly recurring run rate · 30-Day revenue = what the provider recorded in the trailing 30 days. Timing, not extra revenue, is why a ratio can exceed 100%.
Summary
What kind of business is this
Visit site flowboardapp.comFlowboard converts AI-generated HTML, CSS, and JS into editable Webflow native structures, and supports GSAP dynamic effect mapping and Live Capture. It acquires customers through Chrome store ranking, tutorial content, and SEO guides, and then guides users to subscribe and upgrade.
- Product form
- Web online software workstation
- Category
- AI
- Charging method
- Online self-service subscription
Core growth findings
Findings may cite earlier snapshots; header KPIs carry Fact and a revenue as-of date. Revenue as of 2026-11-03.
- 01
Product positioning and self-service conversion
Starting with the core pain point of converting from HTML to Webflow, the page uses paste code to see the Navigator output demonstration, and works with free trial to drive self-service subscription.
- 02
Community and creator dissemination
Borrowing Claude Design workflow, YouTube tutorials and Webflow community word-of-mouth to spread, and driving new users to try out through creator demonstrations.
- 03
Keyword and directory exposure
Centering on long-tail words such as HTML to Webflow and GSAP mapping to create guides and case pages, and obtaining search traffic from the Chrome app store and tool directory.
- Number tags
- FactStraight from the source
- DerivedCalculated from facts
- ClaimedSelf-reported, unverified
- EstimateOur reading
Read this one free
This device has 2 of 2 free full reports left. After this one, the rest of the library needs a membership.
- ?How did Flowboard reach $1,624 30-day revenue and $10,510 all-time?
- ?How are Flowboard's acquisition channels structured?
- ?Which 7 plays drove subscription growth?
- 01The business
- 02Where customers come from
- 03Growth plays
- 04Social & community
- 05Timeline
- 06What to copy
This report is free to read
2 free reports left on this device
Next steps
Copy an agent prompt above, then keep researching related products via MCP.