













How does a single person's analysis tool achieve monthly revenue of $30,000?
Headline cites the Historical Research Snapshot. KPI strip is the Latest Revenue Snapshot.
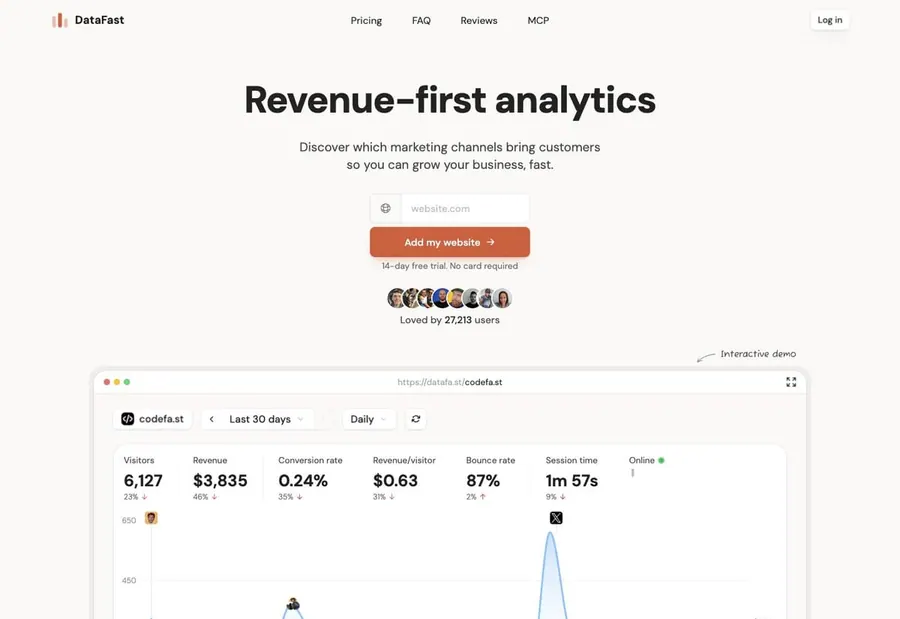
Product at a glance
- what is it
- Website analysis tool: connect payment data and access sources to directly see which marketing channel brings in paying customers.
- who is it for
- Entrepreneurs, independent developers, and marketers who operate their own websites and online businesses.
- how does it charge
- Two tiers, priced by monthly event quantity: 10,000 events at Starter $9/month, Growth $19/month, annual payment $90, $190; Growth adds 30 websites, social media mentions, and X attribution.
- business model
- SaaS subscription by usage: trial without binding card, converted to subscription by event quantity.
- Revenue over the past 12 months
- $274K
- MRR
- $28.8K
- Active Subscriptions
- 1,387
- 9 month revenue
- $31.5K
Accumulated $319K · publicly verified
Open evidenceFact · as of 2026-11-03
Evidence type: Fact
Source: Latest Revenue Snapshot · provider payment sync
as of: 2026-11-03
Provider-verified revenue signal ≠ audited company financials.
30 days -5.6%
Open evidenceFact · as of 2026-11-03
Evidence type: Fact
Source: Latest Revenue Snapshot · provider payment sync
as of: 2026-11-03
Provider-verified revenue signal ≠ audited company financials.
Home page writes '27,200 users'
Open evidenceFact · as of 2026-11-03
Evidence type: Fact
Source: Latest Revenue Snapshot · provider payment sync
as of: 2026-11-03
Provider-verified revenue signal ≠ audited company financials.
Highest in recent 12 months · November 2025 is $16K
Open evidenceFact · as of 2026-11-03
Evidence type: Fact
Source: Latest Revenue Snapshot · provider payment sync
as of: 2026-11-03
Provider-verified revenue signal ≠ audited company financials.
MRR = current monthly recurring run rate · 30-Day revenue = what the provider recorded in the trailing 30 days. Timing, not extra revenue, is why a ratio can exceed 100%.
Summary
What kind of business is this
Visit site datafa.stDataFast answers entrepreneurs' most concerns: which channel really brings in money. Users mainly come from the founder's product updates on X and other users' panels, with a 14-day free trial, then charged $9/month based on website events.
- form
- Web SaaS
- customers
- Entrepreneurs, marketing personnel
- charging
- Subscribe by event quantity
- Starting price
- $9/month
- launch
- 2024-07
- team
- 1 person · Self-funded (Singapore)
Core growth findings
Findings may cite earlier snapshots; header KPIs carry Fact and a revenue as-of date. Revenue as of 2026-11-03.
- 01
The real driver is the founder's X account
Marc Lou has 415,105 X followers, posting one for each feature; the brand account @DataFast_ has only 2,981 followers. A post showing all product income was viewed 1,370,000 times.
- 02
User-posted panels serve as its advertisements
The homepage embeds over 50 users' X posts, many of which are 'switched from Plausible / GA' or showing their own revenue panels. The founder says growth relies on 'word of mouth slowly picking up'.
- 03
Expanding functions allows stagnant revenue to rise again
From March to June 2026, monthly revenue remained around $21,000; after launching robot traffic and MCP in July, it jumped to $27,158 (+26%), and further to $31,455 in September.
- Number tags
- FactStraight from the source
- DerivedCalculated from facts
- ClaimedSelf-reported, unverified
- EstimateOur reading
Read this one free
This device has 2 of 2 free full reports left. After this one, the rest of the library needs a membership.
- ?How does a one-person analytics tool reach $30k a month?
- ?Where do its users mainly come from?
- ?What exactly did the founder do?
- 01The business
- 02Where customers come from
- 03Growth plays
- 04Social & community
- 05Timeline
- 06What to copy
This report is free to read
2 free reports left on this device
Next steps
Copy an agent prompt above, then keep researching related products via MCP.